Lachman CONSULTANTS - Bob Pollock先生
编译:识林-椒
识林®www.shilinx.com版权所有,未经许可不得转载。如需使用请联系admin@shilinx.com
Let's Not Mix Apples with Oranges
By Bob Pollock | May 12, 2016
I have been attempting to compare backlog numbers, receipts of new ANDAs and applications that are in the hands of industry for response to FDA’s Complete Response Letters (CRLs), and it has been quite a struggle. But I think I’ve got it now, and I hope I am right! The way the “backlog” used to be counted pre-GDUFA was simply ANDAs that were pending at OGD. The way it appears to be counted now includes ANDAs pending OGD review and those that are with industry or are already Tentatively Approved, which means OGD will need to touch them again. This dichotomy seems to be at the heart of my dilemma.
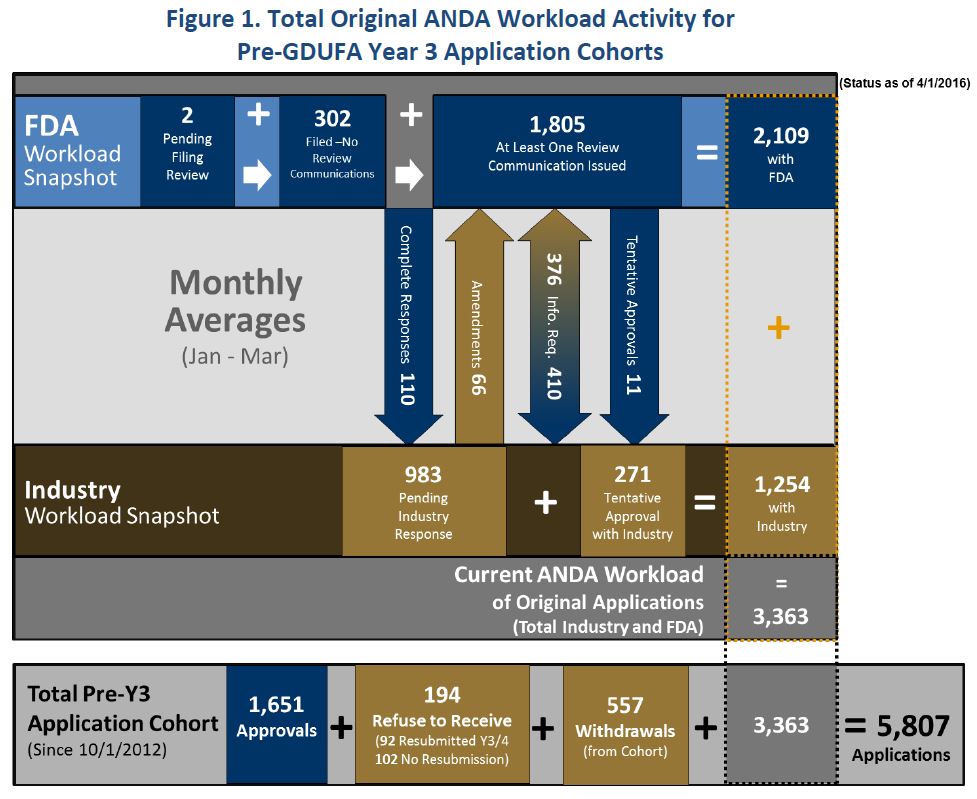
One of the other problems in pinpointing what the real backlog is (besides its definition) is that the needle is continuously moving, so one is never sure of the absolute backlog totals, as applications slip from one category to another every day. So when talking of the “backlog”, one needs to be certain of what they call the backlog. For instance, below is a chart from the Generic Drug Review Dash Board which can be found here.
It focuses on GDUFA pre-year 3 ANDA cohorts (which I am assuming also includes the pre-FY 2012 backlog ANDAs). If this assumption is not correct, then we have a bigger problem. But, if it is correct, then we are in better shape than we may have all considered.
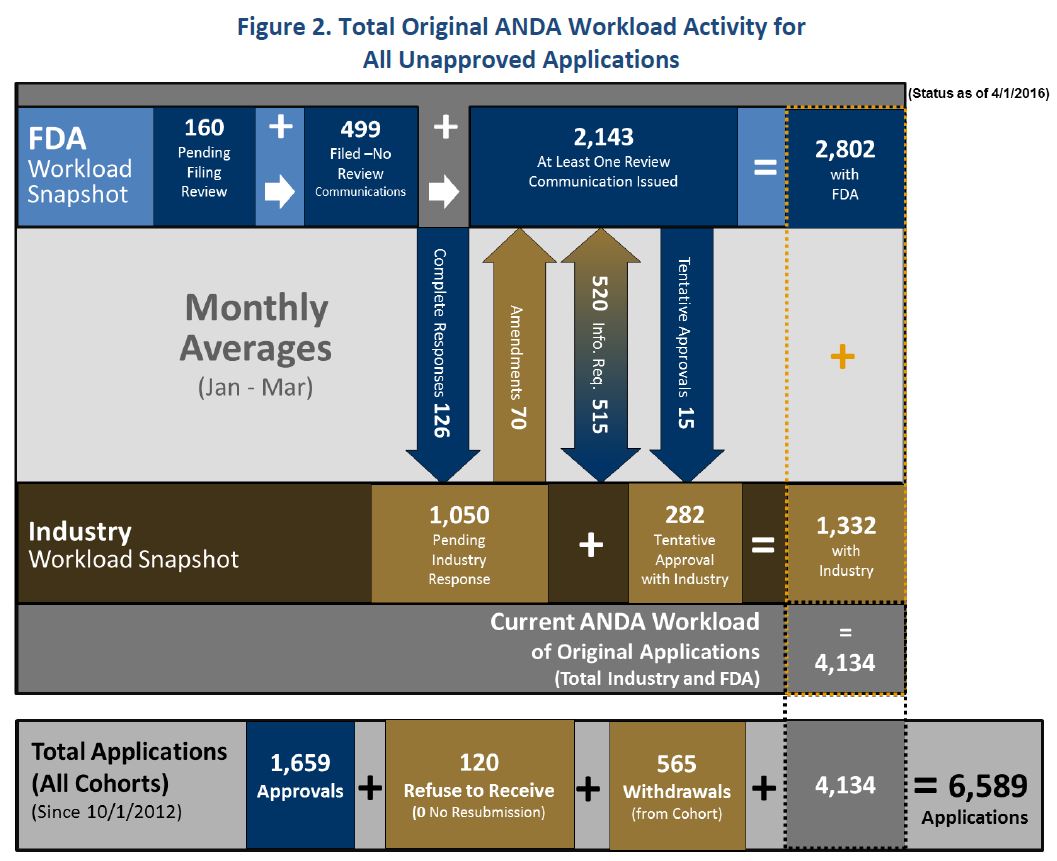
Here is the Generic Drug Review Dashboard report for total ANDA workload activity as reported in the above referenced document.
People (including me) have been reporting a backlog of some 4000+ ANDAs, but that does not seem to be a fair characterization of a comparison to past (pre-GDUFA) reported backlog figures. Why do I say this? As noted above, previous backlog figures have historically counted only those ANDAs that were pending at the Agency (newly received ANDAs and ANDAs for which the industry had responded to an Agency letter). So, in the height of the backlog pre-GDUFA, there were close to 3300 ANDAs in the backlog. OGD reports their total workload in the chart above as 4134 ANDAs; however, that figure includes ANDAs currently pending with industry (not OGD) and those ANDAs that currently have Tentative Approval (which together total 1332). Thus, if we compare the old cited backlog figure of 3300 ANDAs pre-GDUFA (ANDAs pending only at OGD) with the 4134 cited above and subtract 1332 (the ANDAs pending industry and those that are tentatively approved), then the backlog figure those that are pending with FDA is really 2802-which is actually comparable to the total FDA pending ANDA back in August of 2013 of 2780. Considering the large number of ANDAs that have been submitted since FY 2012 (averaging 1018 per year from FY 2012 thru FY 2015), we have a better view of how well OGD is really doing.
Unfortunately, industry measures OGD success primarily by the number of approvals. Maybe we need to factor into the equation the progress that OGD has made and begin to believe that that progress will continue to improve over the rest of FYs 2016 and 2017 and translate to a greater monthly average of approvals. Remember, OGD is on track to hit a record number of approvals post-GDUFA this FY. And also remember that making a comparison of apples to oranges sometimes happens to the best of us!
By the way, OGD just updated its Activities Report of Generic Drug Program FY 2016 showing that in April 2016, OGD issued 192 CRLs, the highest monthly number of CRLs since the inception of the GDUFA program. The second highest month was March 2016, where OGD issued 147 CRLs, and before that, it was 134 CRLs in July of 2015.